
Diagnostics & logs
For server administrators
These tools are for whoever looks after the machine. If playback or a title misbehaves, start with Troubleshooting.
When something is slow, stuck or just surprising, these are the places to look.
Dashboard and analytics
Admin → Dashboard shows the state of the server at a glance: active streams, recently added titles, storage use, worker activity.
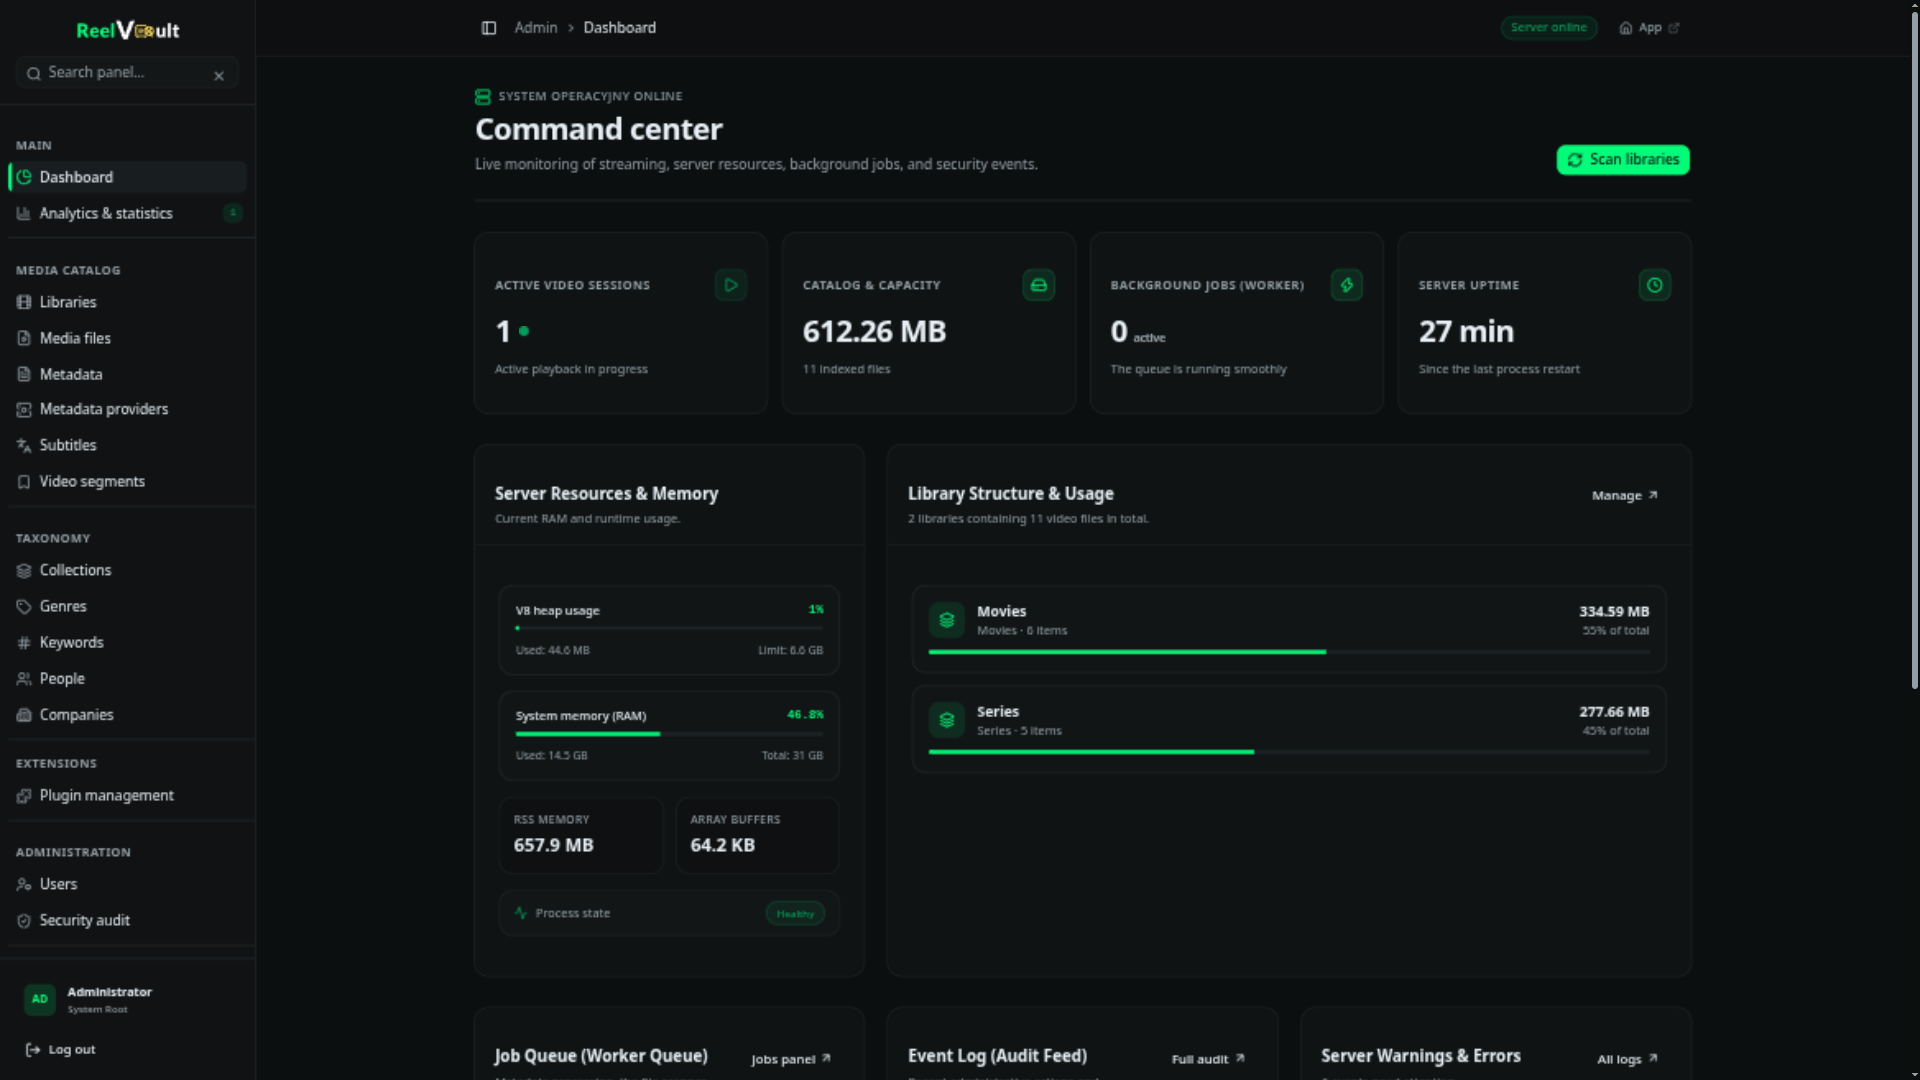
Admin → Analytics & statistics goes deeper — playback over time, popular titles, conversion ratios, per-user activity.
Live activity
Live activity lists playback sessions as they happen: who is watching what, on which device, and whether it is direct play, remux or transcode. Admins can terminate a session from here — handy when a stale stream is holding a conversion slot.
Resources
Admin → System resources covers the machine itself:
- CPU, memory and disk pressure, updated live.
- ffmpeg capabilities — which hardware encoders were detected and verified, with a button to re-run detection after a driver update.
- The rescue state: if the machine comes under sustained pressure, the server pauses background work and stops background ffmpeg processes to keep playback alive. This page tells you when that has happened.
Remote-access readiness lives in a separate Remote access card under Admin → Server settings → Network — see Remote access & TLS.
Logs
Admin → Server logs streams the server log and lets you download or rotate files. Logs live under $ROOT_DIR/logs/:
reelvault.log— the main log.debug.log— extra detail when debug logging is on.
All log lines carry the plugin, worker or request that produced them. Every API request gets a request id; when you report a bug, quote it — it ties the report to the exact log line.
Audit and security
Admin → Security audit records sensitive operations: sign-ins, permission changes, plugin installs, configuration edits. Use it to answer "who changed that?".
Task state
For queues, retries and stuck work, see Background jobs.